Best Techniques and Tools for Scientific Data Visualization 2023
Are you looking for the best scientific data visualization tool? Thinking of visualizing data your way? If yes, you have landed on the right article. Scientific data visualization tools enable users to communicate/perform scientific research using different graphs, charts, and images. There are multiple ways, tools, and techniques found there for science visualizations. […]

Are you looking for the best scientific data visualization tool? Thinking of visualizing data your way? If yes, you have landed on the right article.
Scientific data visualization tools enable users to communicate/perform scientific research using different graphs, charts, and images.
There are multiple ways, tools, and techniques found there for science visualizations. But these tools make sure that you understand those data more easily through the right graphs and data.
We will get into the list of the best scientific visualization tools later in the article. But before choosing or getting started to use these techniques and tools, let’s get to know about their importance!
Benefits of Data Visualization in Science
There is abundant of the importance of big data visualizations in science, let’s get to know about some of it in detail!
- Identify the Data Trends: Data visualization enable the users to visualize all the essential trends going on in the business and other places. This way you can get familiar with all the trends that are up with data. We can’t deny that with research papers online and data visualization tools, the research process would be hectic.
- Easy Decision Making: “A picture is worth a thousand words.” By nature, we as humans tend to process or understand pictures better than words. When things are understood better, it will be easy to make decisions faster and in a precise way. The positive impact on decision-making will help your business grow.
- Machine Learning Models: One of the greatest skills data scientists are bound to gain is building custom machine learning models. In simple words, scientific data visualization helps you come up with efficient models. This way you can build good models with the right amount of accuracy.
- Convenient to Summarize Results: Visual representation of data helps the data science team show and make understand results more conveniently. According to best paper writing services, data visualization plays a huge role in keeping stakeholders aware of projects related to data science.
These are the key importance of using the most responsive and amazing data visualization in science.
Best Techniques and Tools for Scientific Data Visualization
Now without any delay, let us get started to know about the best tools and techniques for scientific data visualization!
1. Integrate.io

Integrate.io is an amazing scientific data visualization tool that enables you to integrate your platform with data visualization software. It has a complete set of ETL tools and connectors to do the visual representation of data.
This tool will help you to easily build and manage clean, secure data pipelines that drive better decision-making. Using this tool, you can integrate more than 100 SaaS applications and data stores. It is the best option for any user who wants a no-code data pipeline platform.
You can centralize your data for a single source of reporting insight. Similarly, you can create both internal and external facing applications with ease. Get scaled, measured and ready to meet any kind of challenges with a complete data platform.
Key Features of Integrate.io:
- Connect up to 150+ destinations and data sources
- Provides total flexibility to evolve with insane support
- Increase repeat buying habits by consolidating data
- Powerful tools and connectors in one low-code platform
- Optimize and sharpen go-to-marketers regardless of company or team size.
2. Tableau
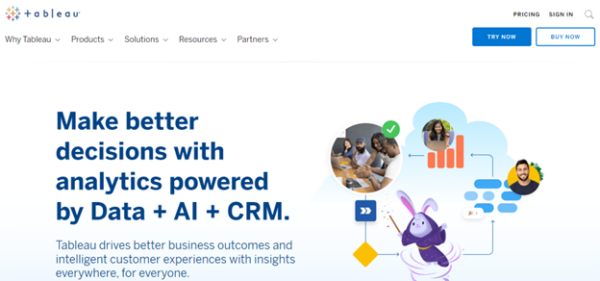
Tableau is an amazing scientific data visualization tool that enables you to drive better outcomes and provide better customer experiences in your business. It is trusted by multiple organizations to be more data-driven along with ease of use and trusted leader.
It helps its users to see and understand data in the simplest way possible. Moreover, you can use data to solve the problems. Along with other million members, you can connect with like-minded people.
This tool analytics is for analysts, executives, IT, and business users from anywhere and everywhere. Similarly, you can empower almost everyone to make data-driven decisions. Its Slack integration lets you expand your deployments with identity pools.
Key Features of Tableau:
- Enables to see AI-driven analytics and predictions in a single platform
- Work smarter, spot trends faster and predict outcomes natively
- Easily discover hidden insights in customer data
- Provides the largest repository of data stories
- Catch up with steaming lives and highlights
3. Zoho Analytics
Zoho Analytics is a modern analytics platform that enables your business to connect with users, prepare and analyze data, create stunning analytics visualization of data, and discover hidden insights.
It lets you deliver deep insights based on business data. Similarly, Zoho Analytics lets its users search for current trends using natural language. Also, 97% of surveyed users prefer these analytics to perform their scientific data visualization.
This tool will help you to transform your data into insights and actions in just a couple of minutes. Also, you can track your key business metrics, see longtime trends, identify outliers and predict the future easily.
Key Features of Zoho Analytics:
- Connect and blend data with a multitude of sources
- Hold conversations with the smart AI assistant and set up a smart alert
- Use an easy drag-and-drop interface to build insightful and interactive reports
- Share with everyone your insights as stories
- Setup enterprise analytics portals in your brands
4. TeamMate Analytics

TeamMate Analytics is a perfect tool for big data visualizations. It provides expert solutions, delivered with premium services. Be familiar with auditors around the globe and in every industry with ease.
You can use the latest technology to demonstrate confidence in your coverage and improve productivity in real-time. Similarly, you can boost the agility to analyze and address all business changes. This way you can make better decisions and stand out from competitors.
Due to its functionality, TeamMate Analytics has been able to obtain the following awards:
- Product of the year
- Winner in Audit Technology
- Category Leader: Internal Audit Solutions
- New Product of the Year in GRC Solutions
- Top 10 in Audit Software
- Best Product in Auditing Innovations
Key Features of TeamMate Analytics:
- Helps to uncover hidden risks and obtain objective and comprehensive results
- Connect easily with critical business systems and key stakeholders
- Eliminate siloed decision-making and improve overall organizational performance
- Over 25 years of dedication to advancing corporate, commercial and public sector audit
- Implementation of IT services, Cloud services and education
Wrapping Up:
Who doesn’t want the task done more easily and reliably? Using these aforementioned tools and techniques for scientific data visualization you can get forward in the software testing world.
It will enable you to design and analyze the data with visual representation. This way you can learn all the recent market trends, and patterns and move accordingly to do better. In simple words, stand out from your business competitors!
If you have used any of these tools, feel free to share your experience with us in the comments section below. Also, let us know if we have missed out on any tools and techniques for scientific data visualization.
We wish you all the best for your scientific data visualization journey!
